GPS Visualizer examples
Here are some actual maps that were created using GPS Visualizer's map generator. For more information on how to construct maps like these, check out the Tutorials.
Leaflet/Google Maps
 |
Geotagged photos on an interactive map |
|
 |
Botanical observations colorized and organized into interactive folders |
|
 |
Full-screen map with resized & colorized markers: 10/15/06 earthquake in Hawaii |
|
 |
Creating a map dynamically ("on the fly") from a Google Spreadsheet |
|
 |
Creating a map dynamically from a GPX file |
|
 |
Map with custom icons: Disc golf courses in Oregon (external site) |
|
 |
Explanation of the fields that can be used in Leaflet/Google Maps |
|
Google Earth
 |
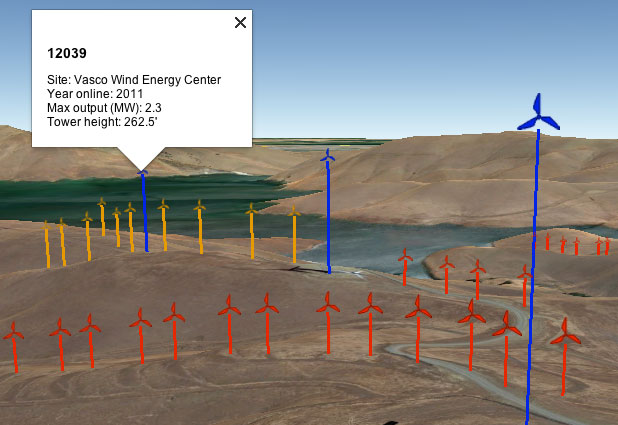
Wind turbines, colorized by power output |
|
 |
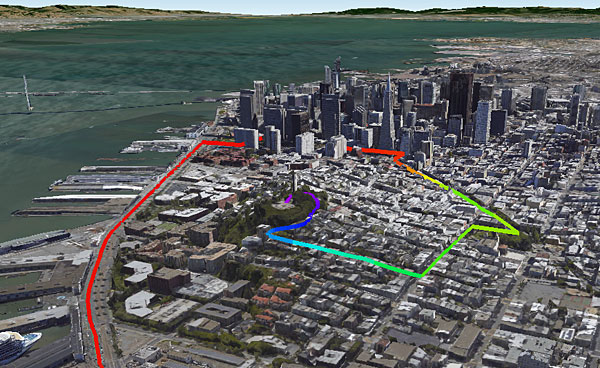
Driving in San Francisco |
|
 |
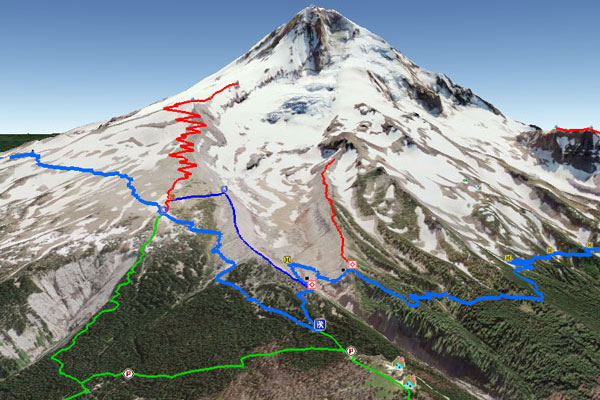
Hiking trails on Mt. Hood, Oregon |
|
 |
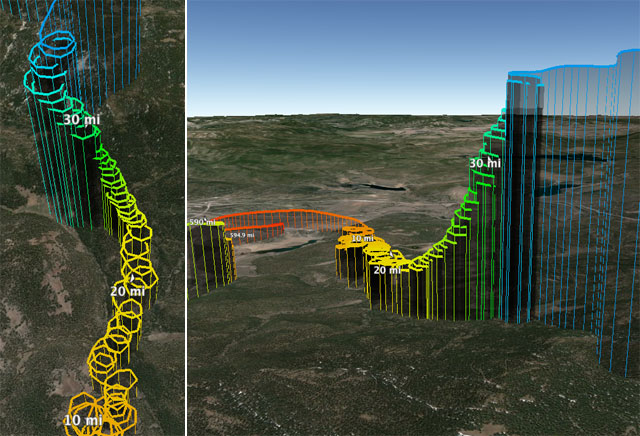
Glider flight near Lake Tahoe, California |
|
|
|
More maps
 |
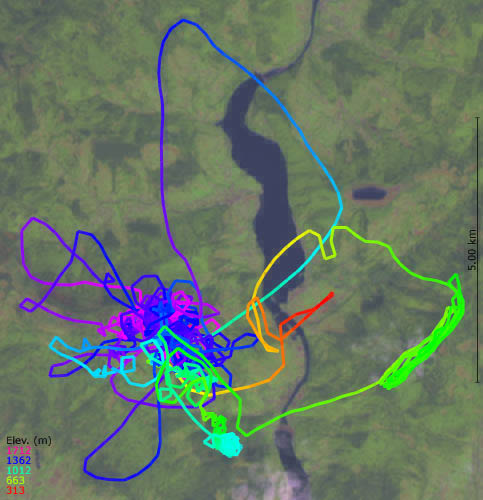
Biking around Santa Cruz, colorized by altitude |
|
 |
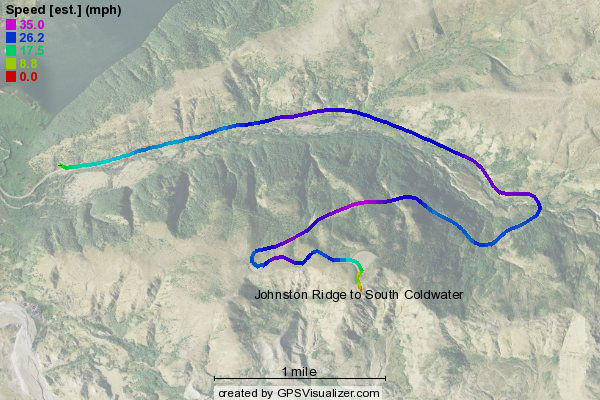
Biking downhill near Mt. St. Helens, colorized by speed |
|
 |
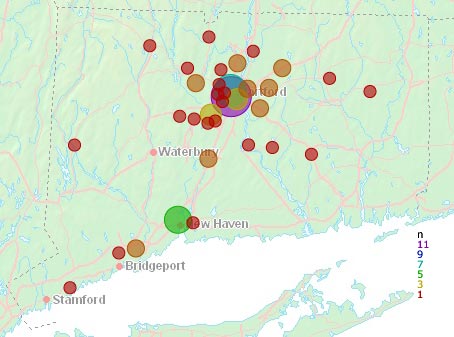
Number of respondents to a survey in Connecticut |
|
 |
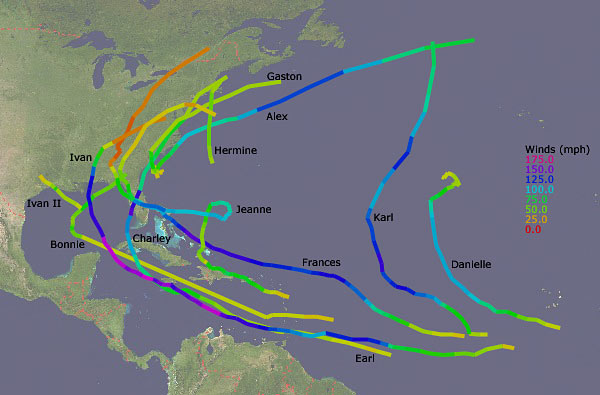
2004 Atlantic hurricanes |
|
 |
Four balloon rides in southern Alberta |
|
 |
Glider flight near Bielsko-Biala, Poland |
|
Profiles
 |
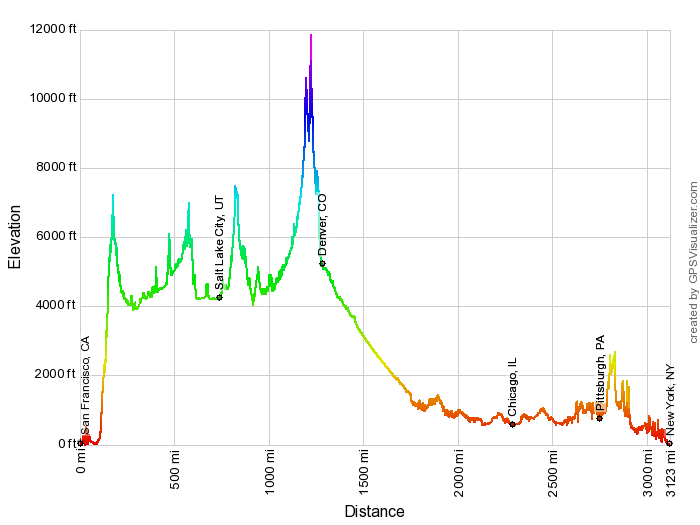
Driving route from San Francisco to New York (elevation profile, colored by elevation) |
|
 |
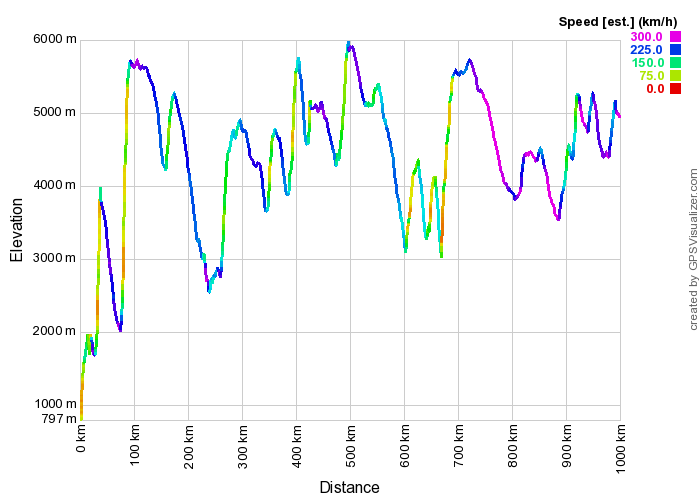
Glider flight over the Andes (elevation profile, colored by speed) |
|
|
Return to the GPS Visualizer home page
|


![adam [at] gpsvisualizer [dot] com](/images/email.svg) .
.