 |
|
|
|
|
|
Tutorial: Calculating Elevation GainLet's be clear: calculating elevation gain is difficult. The difficulty lies not in the calculations themselves, but in the fact that the elevation data is never 100% accurate. There are four ways to get elevation information into a GPS data file:
A very simple exampleHere's a "reductio ad absurdum" example that illustrates some of the problem: Imagine that you're walking along perfectly level ground for 100 meters. You're carrying a GPS device that records the elevation every 5 meters, but the signal wanders up and down a bit; it thinks that each point is 2m above or 2m below the previous one. This is the resulting elevation profile: 
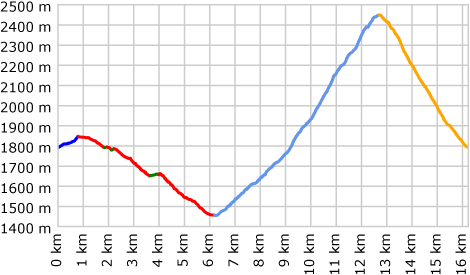
If you add up the gain from all of the blue ascent segments, you get 20 meters — as if you'd climbed up a six-story building. But in this case, we know that it was flat ground, and those 2m peaks and valleys are just noise. A real-world exampleNow let's look at some real data: below is a map and profile of a 16km loop hike around Mt. Hood's Zigzag Canyon that starts in the southeast and goes west and uphill for 0.8 km (blue), then mostly descends for 5.4 km (red), with a few small ascents (green) along the way; then it ascends to the northeast for 6.5 km (light blue), reaching its highest point, and finally descends south back to the starting point (orange). How can we find the true elevation gain of this track? 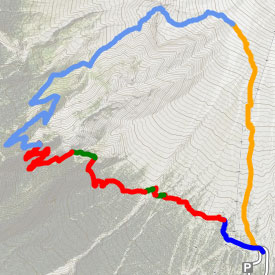
Manual calculationWe'll start with manual calculation, since it is the most accurate, and we can use it as a baseline to evaluate other methods. First, we identify all of the "nodes" (for lack of a better term) where the track switches from uphill to downhill, or vice versa. Then we'll use DEM data to get the actual elevation of those 11 nodes. If we add up the elevation gain of the "up" segments, we get 1068m. The elevation loss in the "down" segments also comes to 1068m, because this trip started and ended at the same point. 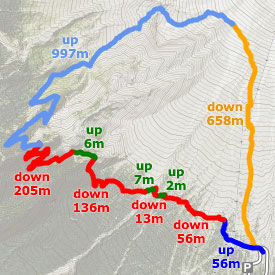
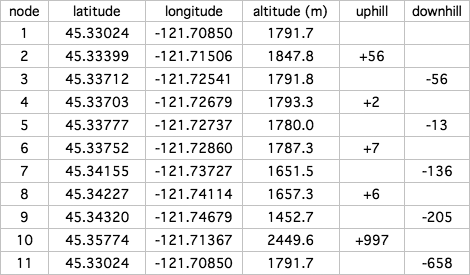
Of course, there's almost always at least a little bit of up and down that wasn't captured by differences between the nodes, so we'll add a little extra and call it 1080 meters. We can feel reasonably confident about this result, but it required a lot of work — not to mention first-hand knowledge of the trail. GPS dataCalculating elevation with GPS data seems straightforward at first: you simply calculate the elevation change between every point in the track. If it goes up, you add it to the "gain" total; if it goes down, you add it to the "loss" total. Here's an example from a spreadsheet that can perform these calculations: 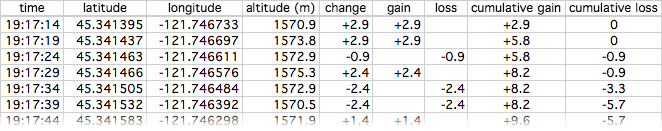
Simple, right? But here's the problem: if we continue this calculation for all 3805 trackpoints, we find an elevation gain of 2326 meters (and a loss of 2322m, because the GPS device can't even agree with itself about the elevation of the starting/ending point). Recall that the correct figure is about 1080 meters; if we use the raw data directly from the GPS, it tells us that we climbed twice as much as we really did! This is a difficult hike, but it certainly doesn't climb 2000+ meters. There's just too much noise in the GPS data. Improvement with DEM dataIf we simply replace the GPS elevation information with data from a Digital Elevation Model (in this case, the USGS's 30m-resolution National Elevation Dataset for the U.S.), the data looks much "smoother," because the elevation number isn't jumping up and down at random like it does on a GPS. Look at the ridiculous peak in the GPS line at around 8.2 km, where the GPS thought 60 meters were gained and then 40 meters lost, when in reality the trail steadily gained about 20 meters: 
The green DEM line is much more reasonable, and we can calculate its gain/loss using the same spreadsheet as in the previous example. This time, the total gain/loss comes out to 1434 meters. This is still about 33% higher than reality, but it's a lot closer than the GPS-only result. But surely we can do better: how can we make the calculations even less sensitive to the jiggles and wobbles that are inherent in GPS tracks? Reducing vertical noiseGPS Visualizer's trackpoint elevation threshold is very similar to the trackpoint distance threshold (described in the "Smoothing & Simplifying Tracks" tutorial). But instead of looking at horizontal distance, it only counts elevation changes once they've passed a certain vertical threshold. 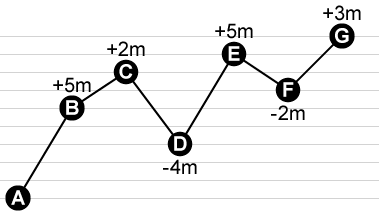
Here's a profile of a hypothetical track with eight points. The horizontal distance is irrelevant; we're just looking at elevation gain. The raw elevation gain (the sum of all the elevation increases) is 5m+2m+5m+3m = 15 meters. The raw elevation loss is -4m-2m = -6m. 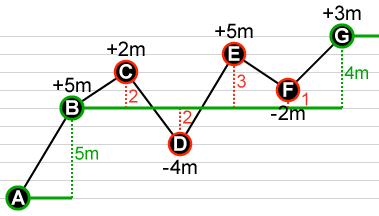
Now we'll apply the trackpoint elevation threshold algorithm, with the threshold set to 4 meters. This means that in calculating the gain/loss, we will ignore any point that is not at least 4m up or down from the last valid point. The first point is always valid, so we'll keep A and color it green. We can also keep B because it's 5m above A, and that clears the threshold; B is now the last valid point. C is only 2m above B, so we toss it out. D is 4m below C — which would have been far enough to pass the 4m threshold — but we removed C, and D is only 2m below our new baseline of B. So D gets removed, as do E and F. 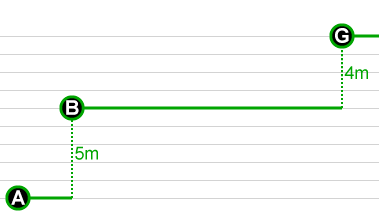
In the end, we're left with just three points: A, B, and G. The elevation gain is 5m + 4m = 9m, and the loss is 0m. Choosing an elevation thresholdIf the hypothetical example of points A through G is from an ascent with no downhill segments, then the elevation threshold algorithm has clearly improved the gain calculation, from 15m down to 9m. On the other hand, if the drop at point D was in fact a real loss of elevation, then we've oversimplified it. It's important to pick a threshold that works well with the data set in question. Let's return to the earlier example — the 16km Zigzag Canyon loop that really has 1080m of gain, but which has 2326m of gain according to the raw GPS data, or 1434m of gain according to DEM data. What happens if we apply a trackpoint elevation threshold? It turns out that applying a threshold of just 1 meter reduces the calculated elevation gain from 1434m to 1314m. A 2m threshold reduces it further, to 1229m. Here's a graph of the full results, using thresholds from 0m all the way up to 20m: 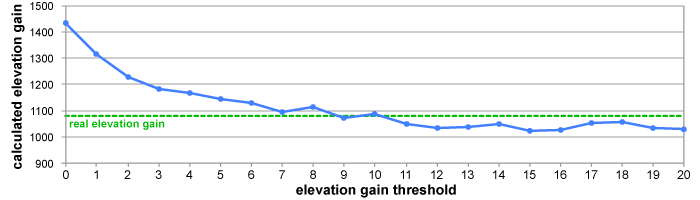
So, in this example, applying an elevation threshold of about 10 meters gets us very close to an accurate result — if we use DEM data. Look what happens if we do the same trials with the original GPS numbers: 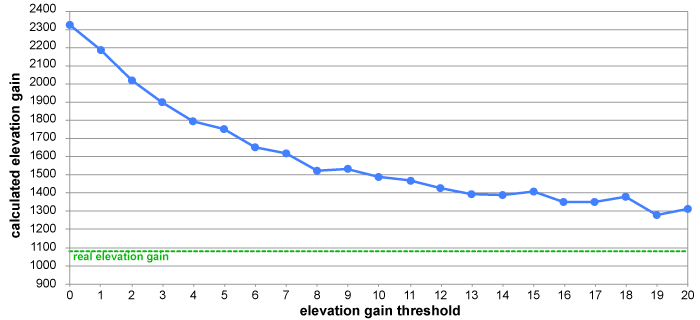
Yikes, that's awful. We should probably stick with DEM! Reducing horizontal noiseSo far, we can see that using DEM elevation data is obviously a better solution than using the raw unfiltered GPS data. But why is the elevation gain estimate still too high until we apply an elevation threshold? Shouldn't the peaks and valleys be smoothed out entirely by the magic of DEM? One problem is that while vertical GPS altitude data is generally pretty bad, the horizontal data is not 100% accurate either. And if a track goes along a hillside, or a valley bottom, or a ridgecrest, that's going to really muck up the elevation data that comes from a DEM database. A visual example should help explain why. Below is a trail along a hillside, as viewed from directly above. The green line represents something close to reality; it follows the trail very closely. The red one wanders a bit, but it's not too horrible... 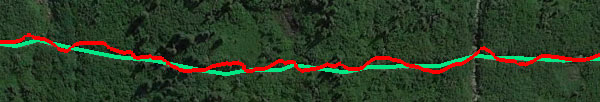
...until we look at it from the side. 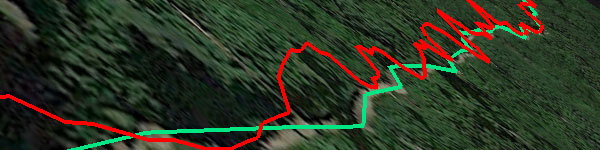
Now it's clear why horizontal wanderings can cause problems with elevation calculations when you use DEM data. The database doesn't know that the wiggles are caused by bad GPS data, and even if the DEM's information is 100% correct, it will lead to weird results. (Garbage in, garbage out, as they say.) Let's look at the elevation profile of these two tracks: 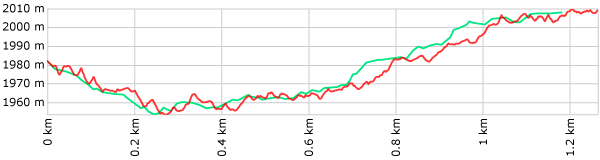
The red line in this example has a calculated elevation gain/loss of 146/119 meters; the green line is 73/47. (And the reality is probably closer to 50/25.) The red line is just too wobbly; is there anything we can do to fix it? Yes, there is: GPS Visualizer has the ability to smooth/simplify tracks using a trackpoint distance threshold. This means that a track's points are discarded unless they are at least a certain horizontal distance from the previous point. (There's a detailed explanation here, if you're interested.) If we apply a 20-meter distance threshold to the red line, it looks a lot less wild: 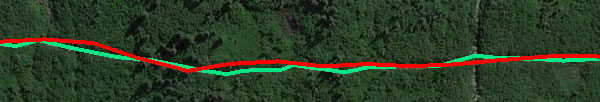
The difference is apparent in the elevation profile too. In fact, the red line's gain/loss is now 78/51 — very similar to the green line — and the total distance has been corrected too. 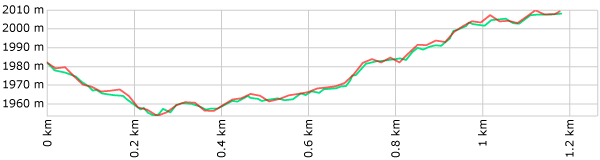
So, clearly, using GPS Visualizer's trackpoint distance threshold function can help you find more accurate elevation gains — not to mention distances. In this example, we used a 20m distance threshold, which is pretty extreme and might remove important details, but a distance filter of 10m or less is usually pretty harmless. To get the most trustworthy results, you might want to apply both distance and elevation filters. And in general, the more you filter your data in the horizontal plane, the less you'll need to apply an elevation threshold. SummaryYour best bet, if you want to find the elevation gain of a track, is to use all three corrections described on this page:
All three of these can be applied at once, if desired, via any of GPS Visualizer's input forms. The result is still not guaranteed to be correct, but the truth is that no Web site or application can promise 100% accuracy in this department. What's unique about GPS Visualizer's methods is that you know exactly what is happening with your data, and you can adjust the process as necessary. Return to the main GPS Visualizer page
|

![adam [at] gpsvisualizer [dot] com](/images/email-11.png) .
.