Drawing circles around multiple points
Triangulation & range ring examples
GPS Visualizer's Geographic Calculators page has a form that allows you to draw a circle of any radius around a specific latitude and longitude. However, if you want to draw circles around multiple points using the Calculators page, you'd have to save all of the coordinates separately and then upload them to a map form.
But there's an easier way to do it: if you go to the map input form and supply a "circle_radius" or "range_ring" field in a manually-created waypoint file (plain text or a spreadsheet; see the tutorial for more info), you can simultaneously draw circles around multiple points. If you separate a list of distances with commas (e.g., "10mi,20mi,30mi"), you can even draw multiple rings around multiple points; see the second example on this page.
NOTE: This works with any kind of maps that GPS Visualizer can produce: Leaflet, Google Maps, Google Earth, JPEG, PNG, or SVG.
|
|
This example shows data from three seismographs that all recorded an earthquake. We know the locations of the three recorders, and the great circle distance from each station to the epicenter of the tremor (the distance is calculated using the time lapse between the arrival of different kinds of earthquake waves), so we should be able to triangulate its position. By drawing a circle of appropriate size around each of the points, we can visually locate the place where the three circles intersect: it's east of the JRO station and north of TIMB, a few kilometers south of Mt. Adams (zoom in).
| latitude | longitude | name | color | circle_radius |
|---|
| 45.5408 | -122.5643 | RBO | red | 105.91 km |
| 46.2751 | -122.2178 | JRO | green | 58.34 km |
| 45.3356 | -121.7101 | TIMB | blue | 89.79 km |
If you manually assign a color to a point, as in the data shown here, the point's range ring(s) will take on that color.
|

|
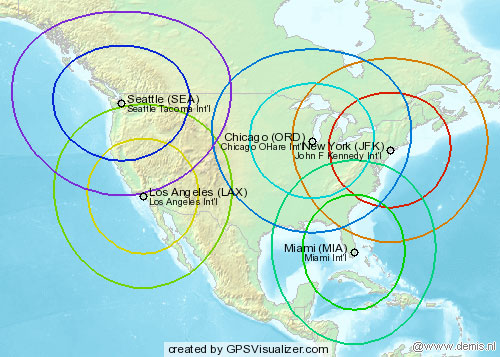
For this map, let's say we want to visualize the flying range of a couple of airplanes from various airports. We'll look at ranges of both 500 and 800 nautical miles; we can do that by simply separating the ranges with commas in the input file. (Note that if your entire file is comma-delimited and you want to draw multiple circles, you must enclose the radii in quotes, or the fields won't line up.)
| airport | circle_radius |
|---|
| JFK | 500 NM, 800 NM |
| LAX | 500 NM, 800 NM |
| MIA | 500 NM, 800 NM |
| ORD | 500 NM, 800 NM |
| SEA | 500 NM, 800 NM |
Because we haven't supplied color values, GPS Visualizer automatically colorizes the "tracks" the same way it would GPS tracks, along a spectrum from red to violet. Also note that the circles don't LOOK like circles because we're looking at a round earth on a flat map... but the positions are correct with respect to the background.
|
Return to the GPS Visualizer home page
|
